
Portal:Maps
| Main page | Maps |
The Maps and Cartography Portal

A map is a symbolic depiction of interrelationships, commonly spatial, between things within a space. A map may be annotated with text and graphics. Like any graphic, a map may be fixed to paper or other durable media, or may be displayed on a transitory medium such as a computer screen. Some maps change interactively. Although maps are commonly used to depict geographic elements, they may represent any space, real or fictional. The subject being mapped may be two-dimensional such as Earth's surface, three-dimensional such as Earth's interior, or from an abstract space of any dimension.
Maps of geographic territory have a very long tradition and have existed from ancient times. The word "map" comes from the medieval Latin: Mappa mundi, wherein mappa meant 'napkin' or 'cloth' and mundi 'of the world'. Thus, "map" became a shortened term referring to a flat representation of Earth's surface. (Full article...)
Cartography (/kɑːrˈtɒɡrəfi/) is the study and practice of making and using maps. Combining science, aesthetics and technique, cartography builds on the premise that reality (or an imagined reality) can be modeled in ways that communicate spatial information effectively. (Full article...)
Selected article -

A proportional symbol map or proportional point symbol map is a type of thematic map that uses map symbols that vary in size to represent a quantitative variable. For example, circles may be used to show the location of cities within the map, with the size of each circle sized proportionally to the population of the city. Typically, the size of each symbol is calculated so that its area is mathematically proportional to the variable, but more indirect methods (e.g., categorizing symbols as "small," "medium," and "large") are also used.
While all dimensions of geometric primitives (i.e., points, lines, and regions) on a map can be resized according to a variable, this term is generally only applied to point symbols, and different design techniques are used for other dimensionalities. A cartogram is a map that distorts region size proportionally, while a flow map represents lines, often using the width of the symbol (a form of size) to represent a quantitative variable. That said, there are gray areas between these three types of proportional map: a Dorling cartogram essentially replaces the polygons of area features with a proportional point symbol (usually a circle), while a linear cartogram is a kind of flow map that distorts the length of linear features proportional to a variable (often travel time). (Full article...)
General images -
-
 CIA map of Iraq, following typical labeling guidelines to maximize legibility and association (from Cartographic design)
 -
 "Mapa de los Estados Unidos de Méjico by John Distrunell, the 1847 map used during the negotiations of the Treaty of Guadalupe Hidalgo ending the Mexican–American War. (from History of cartography)
 -
 A chart of an unidentified area (from History of cartography)
 -
 Illustrated map (from Cartographic design)
 -
 Universalis Cosmographia, the Waldseemüller wall map dated 1507, depicts the Americas, Africa, Europe, Asia, and the Pacific Ocean separating Asia from the Americas. (from History of cartography)
 -
 Modern version of the Roman Tabula Peutingeriana (5th century). (from History of cartography)
 -
-
 The Winkel tripel projection with Tissot's indicatrix of deformation (from Scale (map))
 -
 Infinitesimal elements on the sphere and a normal cylindrical projection (from Scale (map))
 -
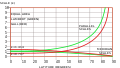 Scale variation for the Lambert (green) and Gall (red) equal area projections. (from Scale (map))
 -
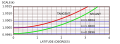 Scale variation near the equator for the tangent (red) and secant (green) Mercator projections. (from Scale (map))
 -
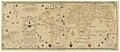
 A general map of the world by Samuel Dunn, 1794, containing star chart, map of the Solar System, map of the Moon and other features along with Earth's both hemispheres. (from History of cartography)
 -
 An early Western Han dynasty (202 BC – 9 AD) silk map found in tomb 3 of Mawangdui Han tombs site, depicting the Kingdom of Changsha and Kingdom of Nanyue in southern China (note: the south direction is oriented at the top, north at the bottom). (from History of cartography)
 -
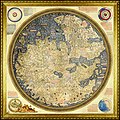 The Fra Mauro map, a medieval European map, was made around 1450 by the Italian monk Fra Mauro. It is a circular world map drawn on parchment and set in a wooden frame, about two meters in diameter. (from History of cartography)
 -
 The Gough Map, a road map of 14th-century Britain (from History of cartography)
 -
 The world according to Hekatæus, 500 BC (from History of cartography)
 -
 Map of Biscayne National Park, Florida, using a variety of point symbols, along with line and area symbols. Note the use of coordinated fill and stroke symbols for the national park area to solve the challenge of a water boundary. (from Cartographic design)
 -
 3D cartography of Washington State, Mount Rainier National Park, Pinnacle Peak trail. (from Cartographic design)
 -
 Reconstruction of Pomponius Mela's world map. (from History of cartography)
 -
 Map of the Holy Land, Pietro Vesconte, 1321. Described by Adolf Erik Nordenskiöld as "the first non-Ptolemaic map of a definite country". (from History of cartography)
 -
 Clay tablet with map of the Babylonian city of Nippur (c. 1400 BC) (from History of cartography)
 -
 A map of Sikkim, India using shaded relief and hypsometric tints (a form of isarithm) to visualize terrain (from Cartographic design)
 -

-
 Lambert's normal cylindrical equal-area projection with Tissot's indicatrix of deformation (from Scale (map))
 -
 The Propaganda Map, a 1529 version of the Padrón Real now held by the Vatican Library. (from History of cartography)
 -
 A portrait of a Dutch mapmaker looking up intently from his charts and holding a caliper, 1714. (from History of cartography)
 -
 The Salviati Planisphere, a 1526 version of the Padrón Real provided by Charles V to the cardinal who officiated his wedding to Isabella of Portugal. (from History of cartography)
 -
 The cartographic process (from Cartographic design)
 -
 The Mercator 1569 world map (from History of cartography)
 -
 The equidistant projection with Tissot's indicatrix of deformation (from Scale (map))
 -
 Charles Joseph Minard's map of Napoleon's Russian campaign of 1812 (1844) has been long recognized as a masterwork of cartographic design at a time when such was difficult and rare. (from Cartographic design)
 -
 The world according to Herodotus, 440 BC (from History of cartography)
 -
 A bar scale with the nominal scale expressed as "1:600 000", meaning 1 cm on the map corresponds to 600,000 cm=6 km on the ground. (from Scale (map))
 -
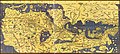
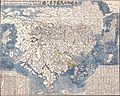 The first Japanese printed map to depict the world, including Europe and America. Printed by woodblock in 1710, composed by the Buddhist monk Rokashi Hotan. (from History of cartography)
 -
 The Equal Earth projection (2018), an increasingly popular equal-area pseudocylindrical projection for world maps (from Cartographic design)
 -
 The Yu Ji Tu, or Map of the Tracks of Yu Gong, carved into stone in 1137, located in the Stele Forest of Xi'an. This 3 ft (0.91 m) squared map features a graduated scale of 100 li for each rectangular grid. China's coastline and river systems are clearly defined and precisely pinpointed on the map. Yu Gong is in reference to the Chinese deity described in the geographical chapter of the Classic of History, dated 5th century BC. (from History of cartography)
 -
 A well-composed transit map of Istanbul, with a high degree of contrast between the symbols, creating a strong visual hierarchy (transit lines are and look most important), figure-ground, and selectivity (the green national rail line can be isolated when necessary). Also note the harmonizing subdued tones of green and blue in the background. (from Cartographic design)
 -
 Blaeu's world map, originally prepared by Joan Blaeu for his Atlas Maior, published in the first book of the Atlas Van Loon (1664) (from History of cartography)
 -
 Al-Masudi's world map (10th century) (from History of cartography)
 -
 The Mercator projection with Tissot's indicatrix of deformation. (The distortion increases without limit at higher latitudes) (from Scale (map))
 -
 Map of the “Inhabited Quarter” by Sadiq Isfahani from Jaunpur c.1647. This was one of the only surviving Indian made maps. (from History of cartography)
 -
 The Da Ming Hun Yi Tu map, dating c. 1390, exists in multicolour format. (from History of cartography)
 -
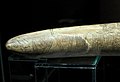 Possibly the oldest surviving map has been engraved on this mammoth tusk, dated to 25,000 BC, found from Pavlov in the Czech Republic. (from History of cartography)
 -
 The Tabula Rogeriana, drawn by Muhammad al-Idrisi for Roger II of Sicily in 1154. Note that the north is at the bottom, and so the map appears "upside down" compared to modern cartographic conventions. (from History of cartography)
 -
 A US civil war hachure paper map made in 1867 by Cartographer Nathaniel Michler vs. modern aerial photos over Chancellorsville, Virginia (from History of cartography)
 -
 The pundit (explorer) cartographer Nain Singh Rawat (19th century) received a Royal Geographical Society gold medal in 1876. (from History of cartography)
 -
 Martin Behaim's Erdapfel (1492) is considered to be the oldest surviving terrestrial globe. (from History of cartography)
 -
 World Map by Juan de la Cosa (1500), the first map showing the Americas. (from History of cartography)
 -
 Nautical chart by Pedro Reinel (c. 1504), one of the first based on astronomical observations and to depict a scale of latitudes. (from History of cartography)
 -
 A chorochromatic map of world land cover, using hue, value, and saturation to differentiate nominal values (from Cartographic design)
 -
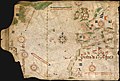
 Surviving fragment of the first World Map of Piri Reis (1513) showing parts of the Americas. (from History of cartography)
 -
Infinitesimal elements on the sphere and a normal cylindrical projection (from Scale (map))
-
 A graphical or bar scale. A map would also usually give its scale numerically ("1:50,000", for instance, means that one cm on the map represents 50,000cm of real space, which is 500 meters) (from Scale (map))


.jpg?lang=en)


.jpg?lang=en)
.jpg?lang=en)


.jpg?lang=en)


Selected quote
| “ | The map is not the territory ... The only usefulness of a map depends on similarity of structure between the empirical world and the map... | ” |
| — Alfred Korzybski | ||
Related portals
Related WikiProjects
Selected biography -

Zhang Heng (Chinese: 張衡; AD 78–139), courtesy name Pingzi, formerly romanized Chang Heng, was a Chinese polymathic scientist and statesman who lived during the Eastern Han dynasty. Educated in the capital cities of Luoyang and Chang'an, he achieved success as an astronomer, mathematician, seismologist, hydraulic engineer, inventor, geographer, cartographer, ethnographer, artist, poet, philosopher, politician, and literary scholar.
Zhang Heng began his career as a minor civil servant in Nanyang. Eventually, he became Chief Astronomer, Prefect of the Majors for Official Carriages, and then Palace Attendant at the imperial court. His uncompromising stance on historical and calendrical issues led to his becoming a controversial figure, preventing him from rising to the status of Grand Historian. His political rivalry with the palace eunuchs during the reign of Emperor Shun (r. 125–144) led to his decision to retire from the central court to serve as an administrator of Hejian Kingdom in present-day Hebei. Zhang returned home to Nanyang for a short time, before being recalled to serve in the capital once more in 138. He died there a year later, in 139. (Full article...)
Selected picture

Did you know
- ... that DeepStateMap.Live, an interactive map of the Russian invasion of Ukraine, received up to 120,000 visitors in 30 minutes during the Battle of Izium in the 2022 Kharkiv counteroffensive?
- ... that Maki Narukido researched the characters' travel times in her manga The End of the World With You using Google Maps?
- ... that Kathryn Maple won the Sunday Times Watercolour Competition twice in three years?
- ... that the Canadian League for Peace and Democracy organized a 10,000-person rally at Maple Leaf Gardens in Toronto to protest a 2,500-person fascist rally?
- ... that the 100 gecs tree was listed as a "place of worship" on Google Maps?
Topics
Map - Atlas - Geography - Topography
Cartography: Cartographers - History of cartography - Ancient world maps - World maps - Compass rose - Generalization - Geographic coordinate system - Geovisualization - Relief depiction - Scale - Terra incognita - Planetary cartography
Map projection: Azimuthal equidistant - "Butterfly" - Dymaxion - Gall–Peters - General Perspective - Goode homolosine - Mercator - Mollweide - Orthographic - Peirce quincuncial - Robinson - Sinusoidal - Stereographic
Maps: Animated mapping - Cartogram - Choropleth map - Estate map - Geologic map - Linguistic map - Nautical chart - Pictorial map - Reversed map - Road atlas - Thematic map - Topographic map - Weather map - Web mapping - World map
Map examples
World

Historical

Thematic
.jpg?lang=en)
Geographic

Political

Nautical

Categories

Things you can do
|
|
Here are some Geography related tasks you can do:
|
Atlases and maps of the world at Wikimedia Commons
Associated Wikimedia
The following Wikimedia Foundation sister projects provide more on this subject:
-
 Commons
Free media repository -
 Wikibooks
Free textbooks and manuals -
 Wikidata
Free knowledge base -
 Wikinews
Free-content news -
 Wikiquote
Collection of quotations -
 Wikisource
Free-content library -
 Wikiversity
Free learning tools -
 Wiktionary
Dictionary and thesaurus


