
Talk:Mandelbrot set
| This is the talk page for discussing improvements to the Mandelbrot set article. This is not a forum for general discussion of the subject of the article. |
Article policies
|
| Find sources: Google (books · news · scholar · free images · WP refs) · FENS · JSTOR · TWL |
| Archives: 1, 2, 3, 4Auto-archiving period: 3 months |
 | Mandelbrot set was a good articles nominee, but did not meet the good article criteria at the time. There may be suggestions below for improving the article. Once these issues have been addressed, the article can be renominated. Editors may also seek a reassessment of the decision if they believe there was a mistake. | |||||||||
| ||||||||||
| Material from Mandelbrot set was split out into Plotting algorithms for the Mandelbrot set on 22:09, 11 February 2020 from this version. The former page's history now serves to provide attribution for that content in the latter page, and it must not be deleted so long as the latter page exists. Please leave this template in place to link the article histories and preserve this attribution. |
| This It is of interest to the following WikiProjects: | ||||||||||||||||||||||||
| ||||||||||||||||||||||||


First appearance of Mandelbrot set?
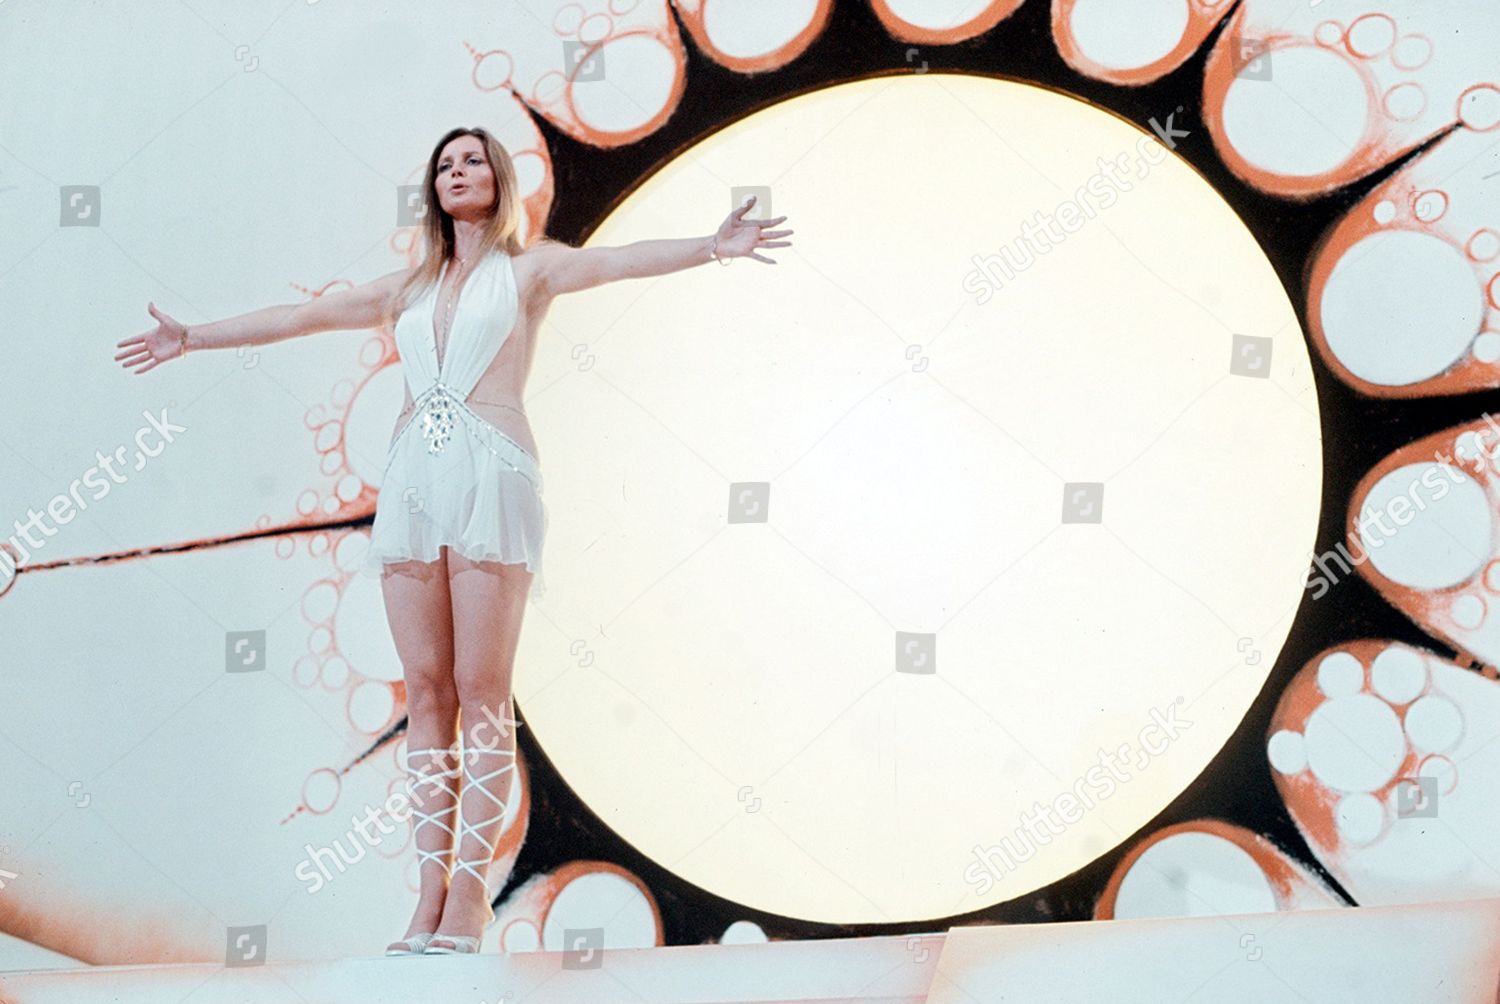
[edit]The Mandelbrot set was used as a decorative motif for a kind of space portal in Episode 11 of Space 1999. The episode was broadcast in 1975: https://editorial01.shutterstock.com/wm-preview-1500/813719gk/4fbb5a0c/gtv-archive-shutterstock-editorial-813719gk.jpg
Code example
[edit]I have my own code, similar to the Python example, in Haskell. It's more performant, and IMO much more elegant. Python is a horrible language for maths-y stuff like this, with the imperative constructs obscuring what's really going on. But obviously we wouldn't want to clutter the article with examples in ten different programming languages, so I'm wary of starting a trend. Plus of course Haskell is semi-obscure, and I may be overestimating the extent to which people would find this code reasonably intuitive.
What's best practice here?
import Codec.Picture
import Data.Colour.RGBSpace.HSV
import Data.Colour.SRGB
import Data.Complex
import Data.List

width = 500
height = 500
(xMin, xMax) = (-2, 2)
(yMin, yMax) = (-2, 2)
bound = 2
maxIterations = 50
power = 2
setColour = PixelRGB8 0 0 0
iterationsToColour n = PixelRGB8 (floor $ 255 * r) (floor $ 255 * g) (floor $ 255 * b)
  where
    t = fromIntegral n / fromIntegral maxIterations
    RGB r g b = hsv (290 * (1 - t)) 1 (t * 5)

main = writePng "mandelbrot.png" $ generateImage
    ( \x y ->
        let x' = fromIntegral x / fromIntegral width * (xMax - xMin) + xMin
            y' = fromIntegral y / fromIntegral height * (yMin - yMax) + yMax
         in maybe setColour iterationsToColour
                $ findIndex ((>= bound) . magnitude)
                $ take maxIterations
                $ iterate (\z -> z ** power + (x' :+ y')) 0
    )
    width
    height
Georgefst (talk) 21:50, 29 June 2025 (UTC)
Understanding the lede
[edit]As far back as 2006, editors were complaining suggesting that the first paragraph or two needed to be revised and simplified enough for a general reader to be able to understand what a Mandelbrot set is. Some efforts were made to that end, but today, the first paragraph has become well-nigh incomprehensible to non-mathematician readers. I conversed with ChatGPT on the issue. Here is a key selection from its responses:
"Plain-English definition of the Mandelbrot set:
The Mandelbrot set is a shape you get by following a simple repetitive process with numbers: Pick a candidate number (a point on a flat plane). Start with zero. Repeatedly take the current number, do a simple operation (square it), and then add back the candidate number. Watch the result: if it never grows too big, the candidate is part of the set; if it eventually shoots off to infinity, it’s not.
Do this for many candidate numbers across the plane. The ones that never escape form a connected black shape — the Mandelbrot set."
I think this AI text offers a good framework for how to write a lede paragraph for this article. I do not suggest it simply be copied. I do suggest that knowledgeable editors can use it as a guide to rewrite the first paragraph. The paragraph should state in plain English (not a formula) what the basic algorithm is. The paragraph should also make the point that the Mandelbrot set is not "drawn" by the algorithm, but rather, that it is revealed by the algorithm. Here is how ChatGPT explains that concept:
"The algorithm itself doesn’t 'draw' the shape -
The algorithm only tells you, for each candidate, whether it stays bounded.
The overall heart-shaped cardioid, side bulbs, and fractal edges are not created by the algorithm directly — they emerge from the pattern of all candidate numbers that happen to remain bounded."
I write this post as a reader (and editor) who is a non-mathematician. I know that technically qualified editors tend to feel very strongly that a technical or mathematical topic should be introduced in very precise technical language to avoid ambiguity or inaccuracy. I believe, however, that even a highly technical topic like this can be introduced in a reader-friendly way that serves the Wikipedia audience--even those who may never have taken a math class. I am not saying that ChatGPT can be a source for Wikipedia. I am saying that the text I extracted from my interaction with it shows how it is possible to introduce this subject in plain language. I am not suggesting removal of any technical parts. I simply request that (at least) the first paragraph be re-done so the broadest possible readership can understand it. That is also the recommendation of multiple Wikipedia policies. DonFB (talk) 08:06, 30 August 2025 (UTC)
Picture of the set overlaid with complex number plane grid
[edit]Quite often I find myself in the want of looking at a picture of the set with coordinate grid overlay. However obvious this request may appear, I struggle to find a quality picture like that online, and there seem to be none on Wikimedia. What I mean is an image where one can see clearly where the origin is, where 1 and i are, how far and in which directions on the Complex number plane the set extends. I've made a picture like that for my own use, do you think it would be useful to display on this page? melikamp (talk) 23:29, 23 September 2025 (UTC)
- Looks like it's on Wikimedia!
- https://commons.wikimedia.org/wiki/Category:Fractals_created_by_User:_Aokoroko
- Pascal, ffmpeg and FASM. Image, Video, gif. Great job! Aokoroko (talk) 13:39, 28 September 2025 (UTC)
- None of the linked ones have a coordinate grid, though may be I am missing something. melikamp (talk) 06:17, 29 September 2025 (UTC)
- Fragment of the Mandelbrot set, coordinates: -0.53574936096559973, 0.52584516139308231 width 0.0000000000000035
- This is a coordinate grid!!!
- And it in Pascal language. This code can be compiled with Delphi or with Free Pascal. Aokoroko (talk) 17:42, 30 September 2025 (UTC)
- I went ahead and added it to the Definition section, hope it's useful :) melikamp (talk) 00:33, 3 October 2025 (UTC)
Art and the Mandelbrot set
[edit]Is it possible to use the Mandelbrot set - Art and the Mandelbrot set? Is it before References in Popular Culture? Here are mine - https://commons.wikimedia.org/wiki/Category:Fractals_created_by_User:_Aokoroko Many have recognized them as high-quality images! Can I make 10 of them? Aokoroko (talk) 19:24, 30 September 2025 (UTC)
- Undid revision (((((((( "A stupendously large number of other pictures have been generated" - WHERE??? Can you find at least one? Where And "Quality image"??? Aokoroko (talk) 09:03, 7 October 2025 (UTC)
- https://commons.wikimedia.org/wiki/Commons:Quality_images
- Non-photographic media 37.215.35.217 (talk) 10:24, 8 October 2025 (UTC)
- Former good article nominees
- C-Class level-5 vital articles
- Wikipedia level-5 vital articles in Mathematics
- C-Class vital articles in Mathematics
- C-Class mathematics articles
- Mid-priority mathematics articles
- C-Class Systems articles
- Mid-importance Systems articles
- Systems articles in chaos theory
- WikiProject Systems articles