
Contour line


Contour lines or isolines are used when plotting a function of 2 variables. All the points where the function has the same value are connected. Two well-known examples where such lines are common are: height lines drawn on topographical maps, and showing areas with the same pressure or temperature on weather charts. Contour lines are an application of level sets.
-
 A map of Stowe VT with height lines
 -
 World map showing magnetic lines, for the year 2000
 -
-
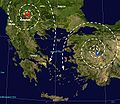
 Temperature diagram of Norway: areas with the same temperature range have the same colour.
 -
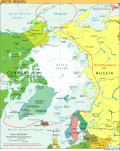 The +10 degree celsius isotherm (July) is commonly used to define the Arctic region.


